Step 1: Create a Google Spreadsheet
Step 2: Record Lab Data on Google Spreadsheet
Step 3: Copy data table from spreadsheet into the blog post.
| Column 1 | Column 2 | Column 3 |
| 5 | 8 | 1 |
| 3 | 4 | 3 |
| 1 | 5 | 6 |
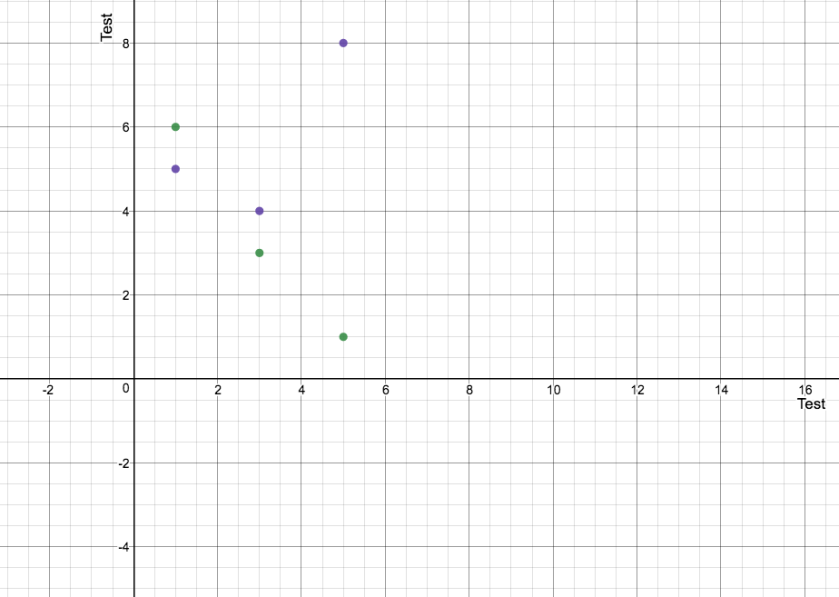
Step 4: Copy data table from spreadsheet into Desmos.
Step 5: Label axes, title, and units appropriately.
Step 6: Click “Share” button, and copy “Image” URL (ending in .png).
Step 7: Insert Image URL into Blog post using Image command.
Step 8: Click on image and click “Caption” icon. Give Graph a title.
Step 9: Publish, and share on Google Classroom.
OR
Instead of using Desmos, you can just use Google Spreadsheet. Create a chart using data. Click drop down menu, click “Download Image”. Re-Upload image to WordPress.
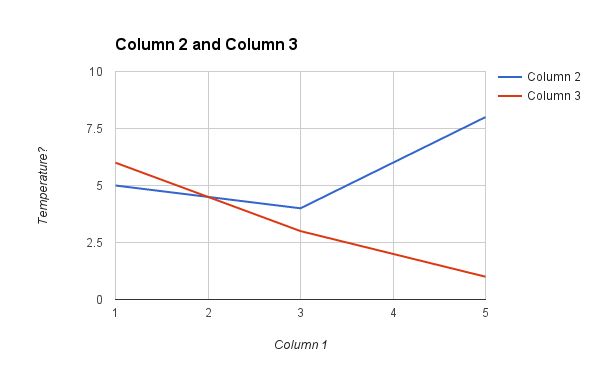
This method allows you to do everything from Google Spreadsheet, and provides better labeling, but students will need to be taught how to make good charts. Maybe make a tutorial?
Another way using Google Sheets
You can publish the chart and embed it. This provides a little more interactivity, but requires students to know how to access and edit the HTML of the blog post to paste the embed code in the proper place.