Ice Core Blog Reflection
“What is the relationship between CO2 and temperature over the past 400,000 years? How do we know about this relationship?”
Over the last 800,000 years atmospheric CO2 levels as indicated by the ice-core data have fluctuated between 170 and 300 parts per million by volume (ppmv), corresponding with conditions of glacial and interglacial periods. The Vostok core indicates very similar trends. Prior to about 450,000 years before present time (BP) atmospheric CO2 levels were always at or below 260 ppmv and reached lowest values, approaching 170 ppmv, between 660,000 and 670,000 years ago. The highest pre-industrial value recorded in 800,000 years of ice-core record was 298.6 ppmv, in the Vostok core, around 330,000 years ago. Atmospheric CO2 levels have increased markedly in industrial times; measurements in year 2010 at Cape Grim Tasmania and the South Pole both indicated values of 386 ppmv, and are currently increasing at about 2 ppmv/year.
Temperature and Time Data
This is my data:
| Time (min) | Temperature (C) |
| 3 | 25.0 |
| 6 | 25.3 |
| 9 | 26.0 |
| 12 | 27.4 |
My chart is below:
How to add graphs and data tables into WordPress
Step 1: Create a Google Spreadsheet
Step 2: Record Lab Data on Google Spreadsheet
Step 3: Copy data table from spreadsheet into the blog post.
| Column 1 | Column 2 | Column 3 |
| 5 | 8 | 1 |
| 3 | 4 | 3 |
| 1 | 5 | 6 |
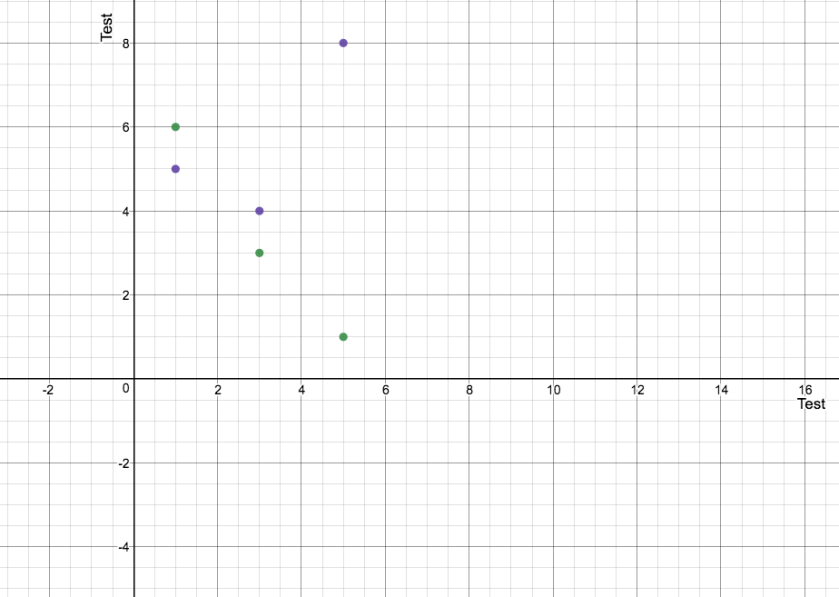
Step 4: Copy data table from spreadsheet into Desmos.
Step 5: Label axes, title, and units appropriately.
Step 6: Click “Share” button, and copy “Image” URL (ending in .png).
Step 7: Insert Image URL into Blog post using Image command.
Step 8: Click on image and click “Caption” icon. Give Graph a title.
Step 9: Publish, and share on Google Classroom.
OR
Instead of using Desmos, you can just use Google Spreadsheet. Create a chart using data. Click drop down menu, click “Download Image”. Re-Upload image to WordPress.
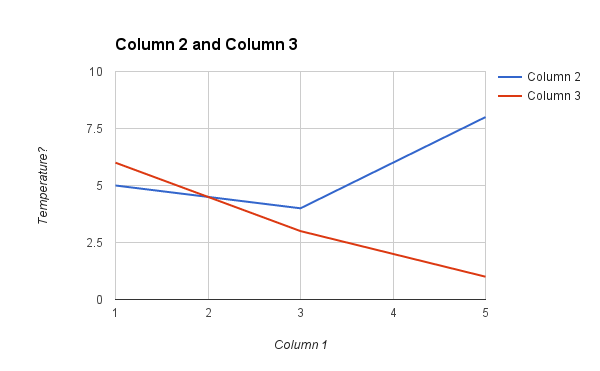
This method allows you to do everything from Google Spreadsheet, and provides better labeling, but students will need to be taught how to make good charts. Maybe make a tutorial?
Another way using Google Sheets
You can publish the chart and embed it. This provides a little more interactivity, but requires students to know how to access and edit the HTML of the blog post to paste the embed code in the proper place.
First blog post
This is the excerpt for your very first post.

This is your very first post. Click the Edit link to modify or delete it, or start a new post. If you like, use this post to tell readers why you started this blog and what you plan to do with it.
